Overview
The problem
Road safety in Kathmandu lacks data-driven infrastructure — accident patterns exist in the raw data but aren't visible or actionable to anyone without a way to surface them.
What it is
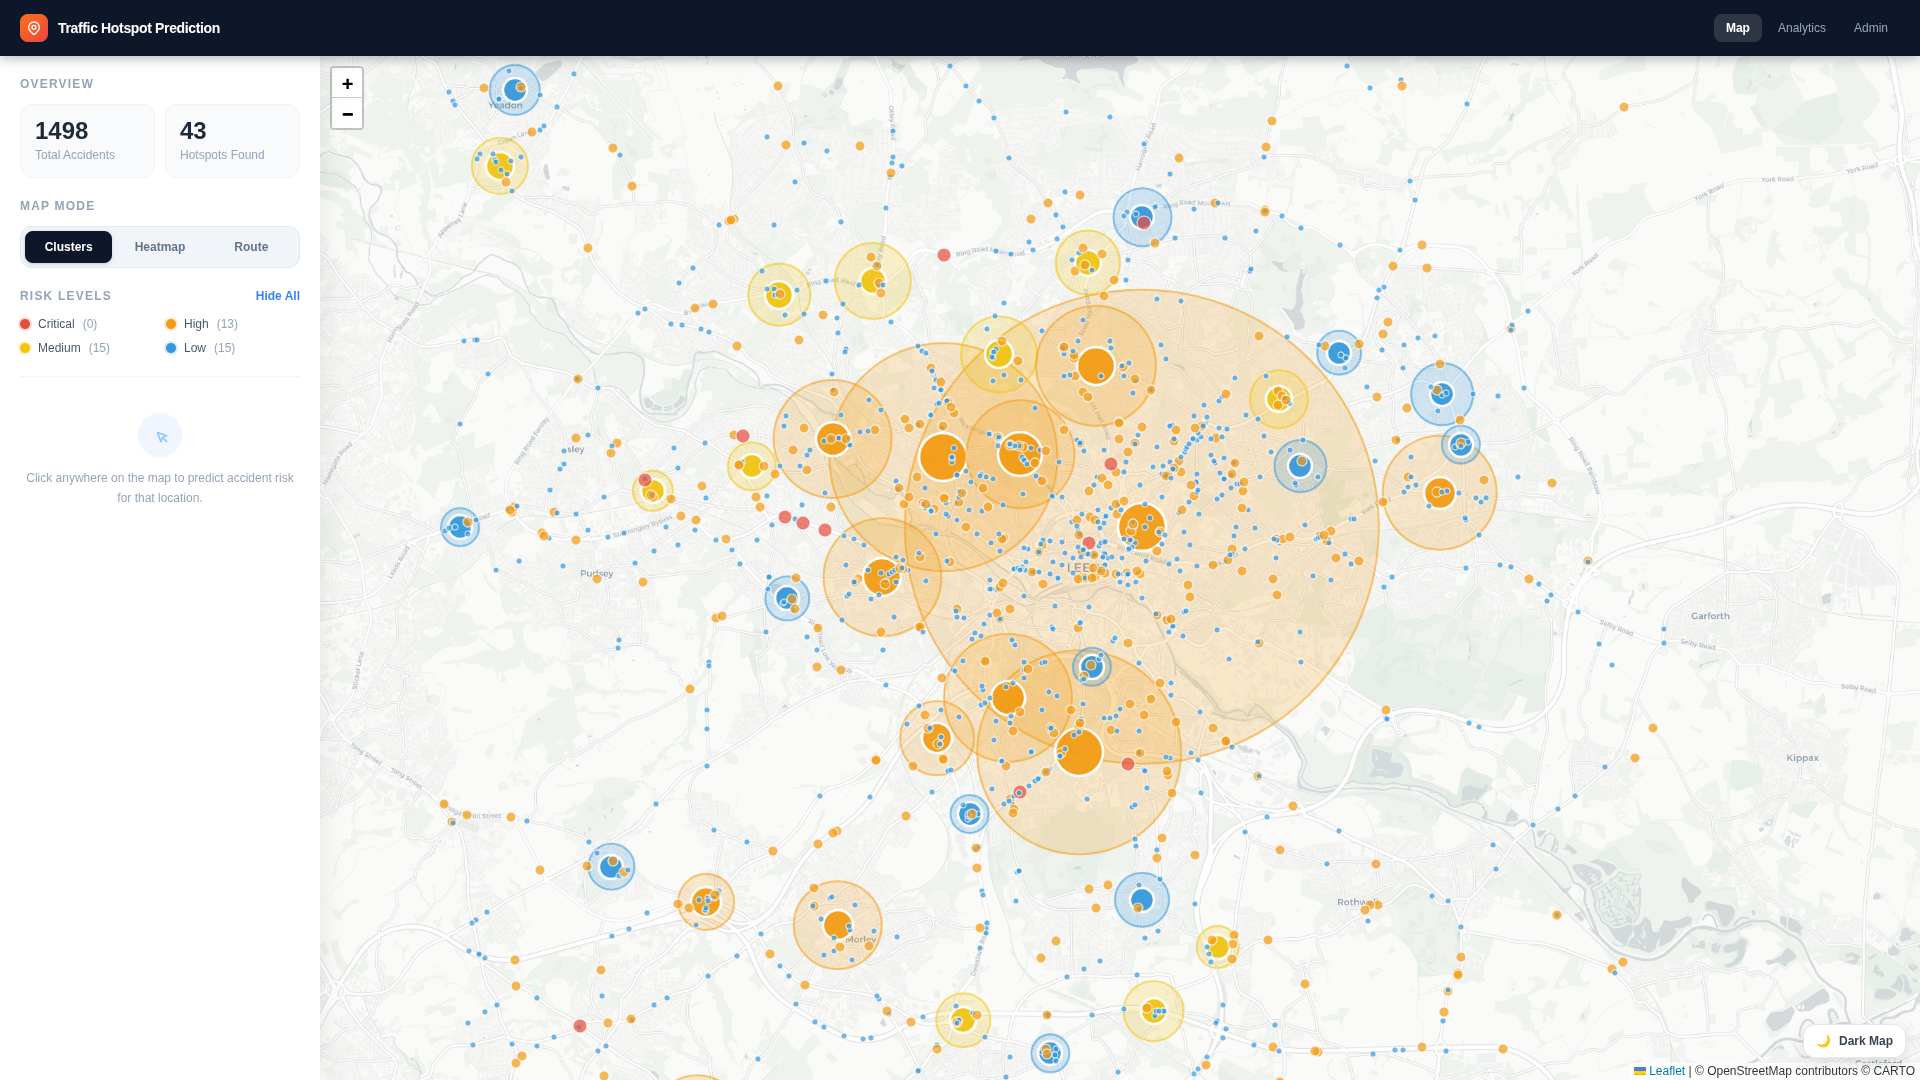
Road safety in Kathmandu lacks data-driven infrastructure. This system ingests real accident records, applies DBSCAN clustering to surface 43 statistically significant hotspots, and layers a Random Forest model on top to predict risk given conditions like time of day, weather, and road type. The result is a live map interface that makes the patterns visible and actionable.
My role & approach
Solo project — I designed the data pipeline, engineered features from the raw accident records, trained the DBSCAN and Random Forest models, and built the full Django backend, REST API, and Leaflet/Chart.js map interface end to end.
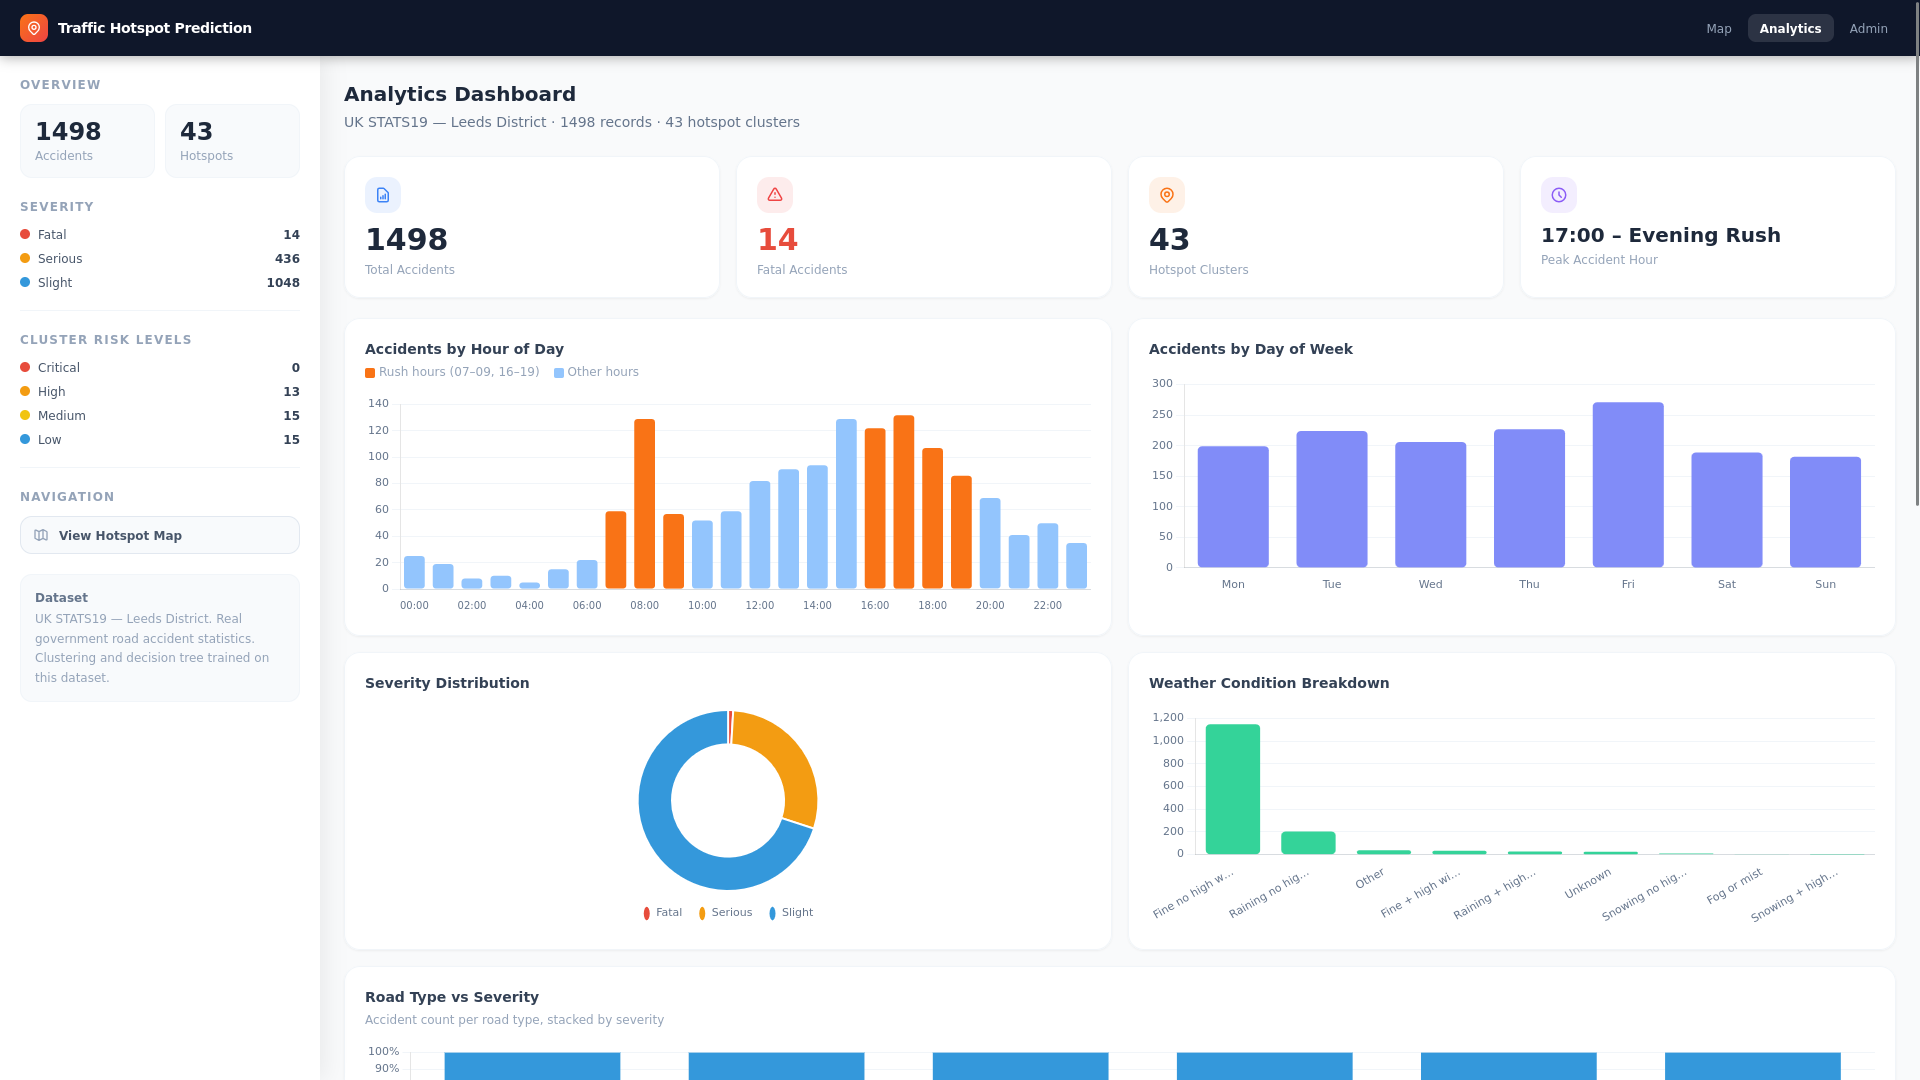
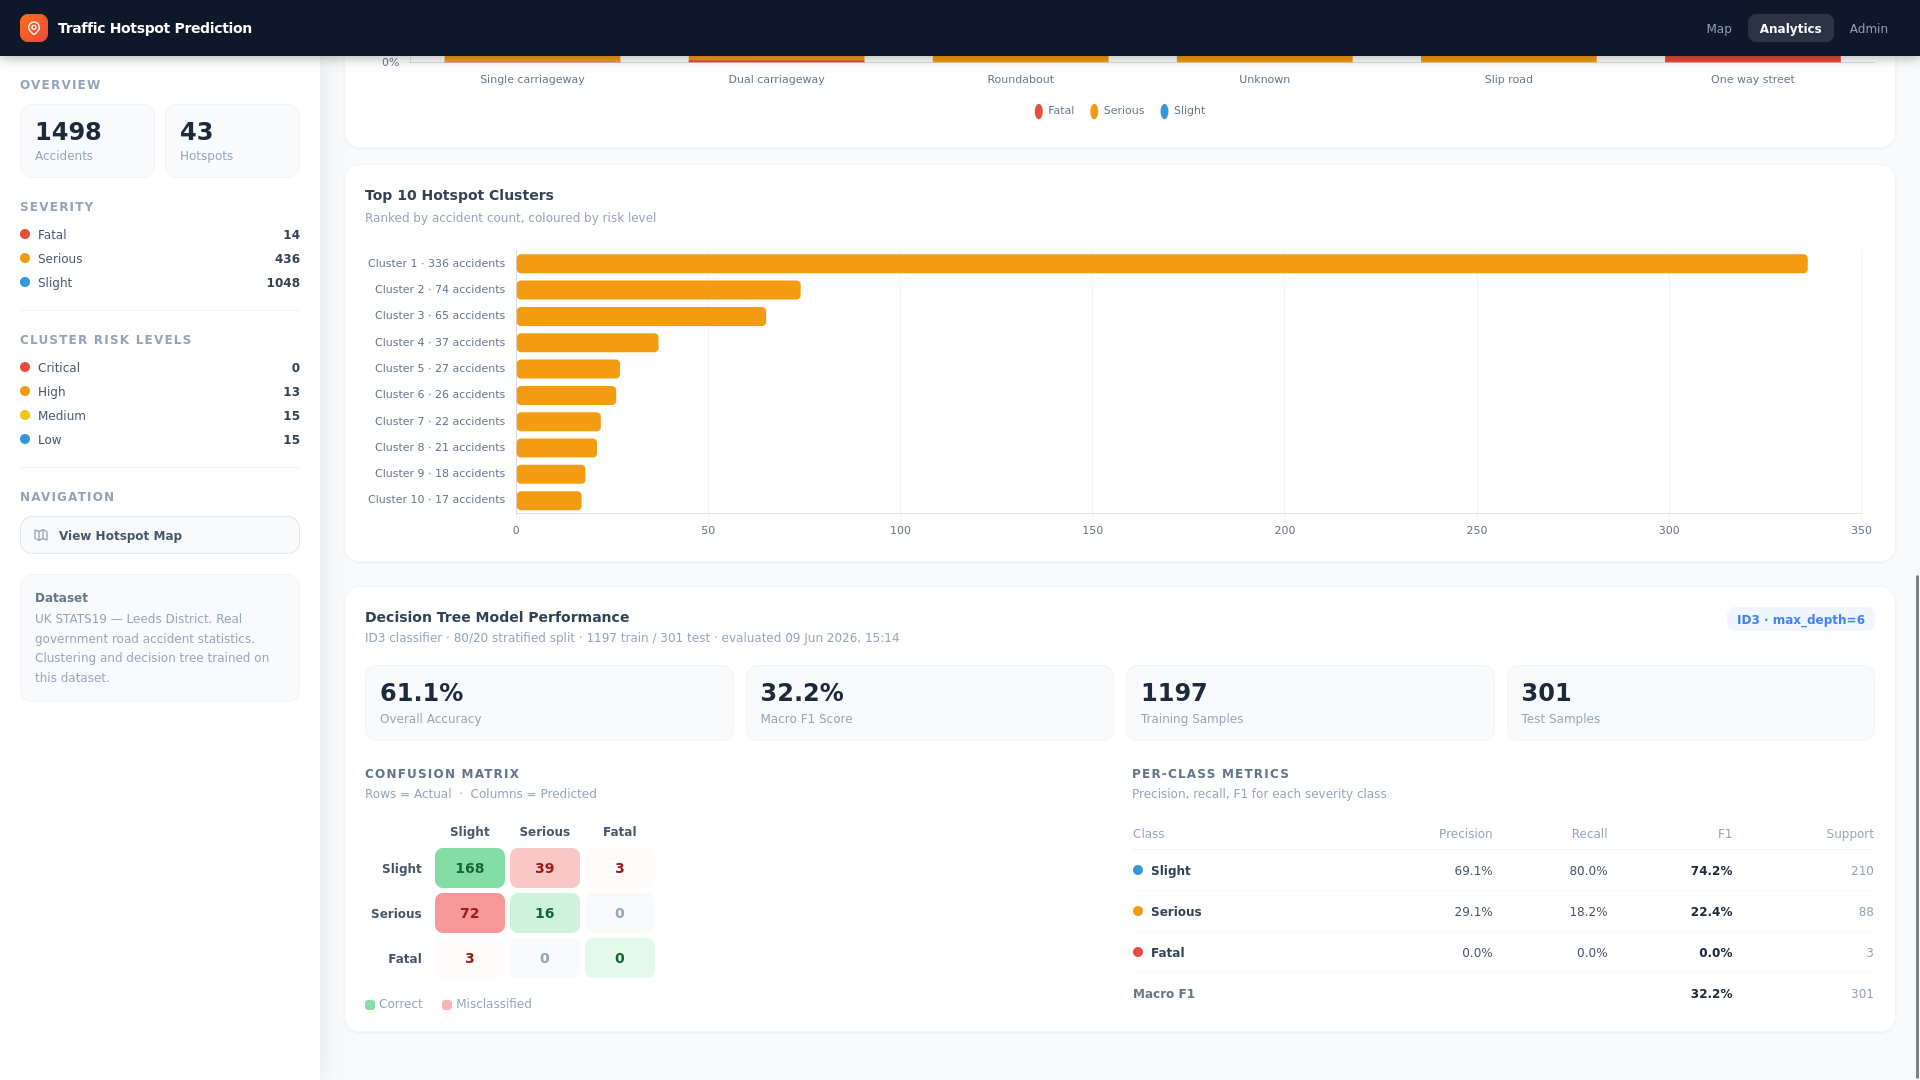
DBSCAN was chosen over k-means because accident hotspots are irregularly shaped and vary in density — k-means would have forced arbitrary cluster boundaries. The Random Forest model was trained on engineered features from the accident records including hour bins, weather codes, and road classifications. The Django backend serves predictions via REST API, with Leaflet.js rendering the map and Chart.js handling the risk breakdowns.
Stack
A closer look
Impact
1,498 real accident records processed and clustered
43 distinct hotspots identified across the dataset
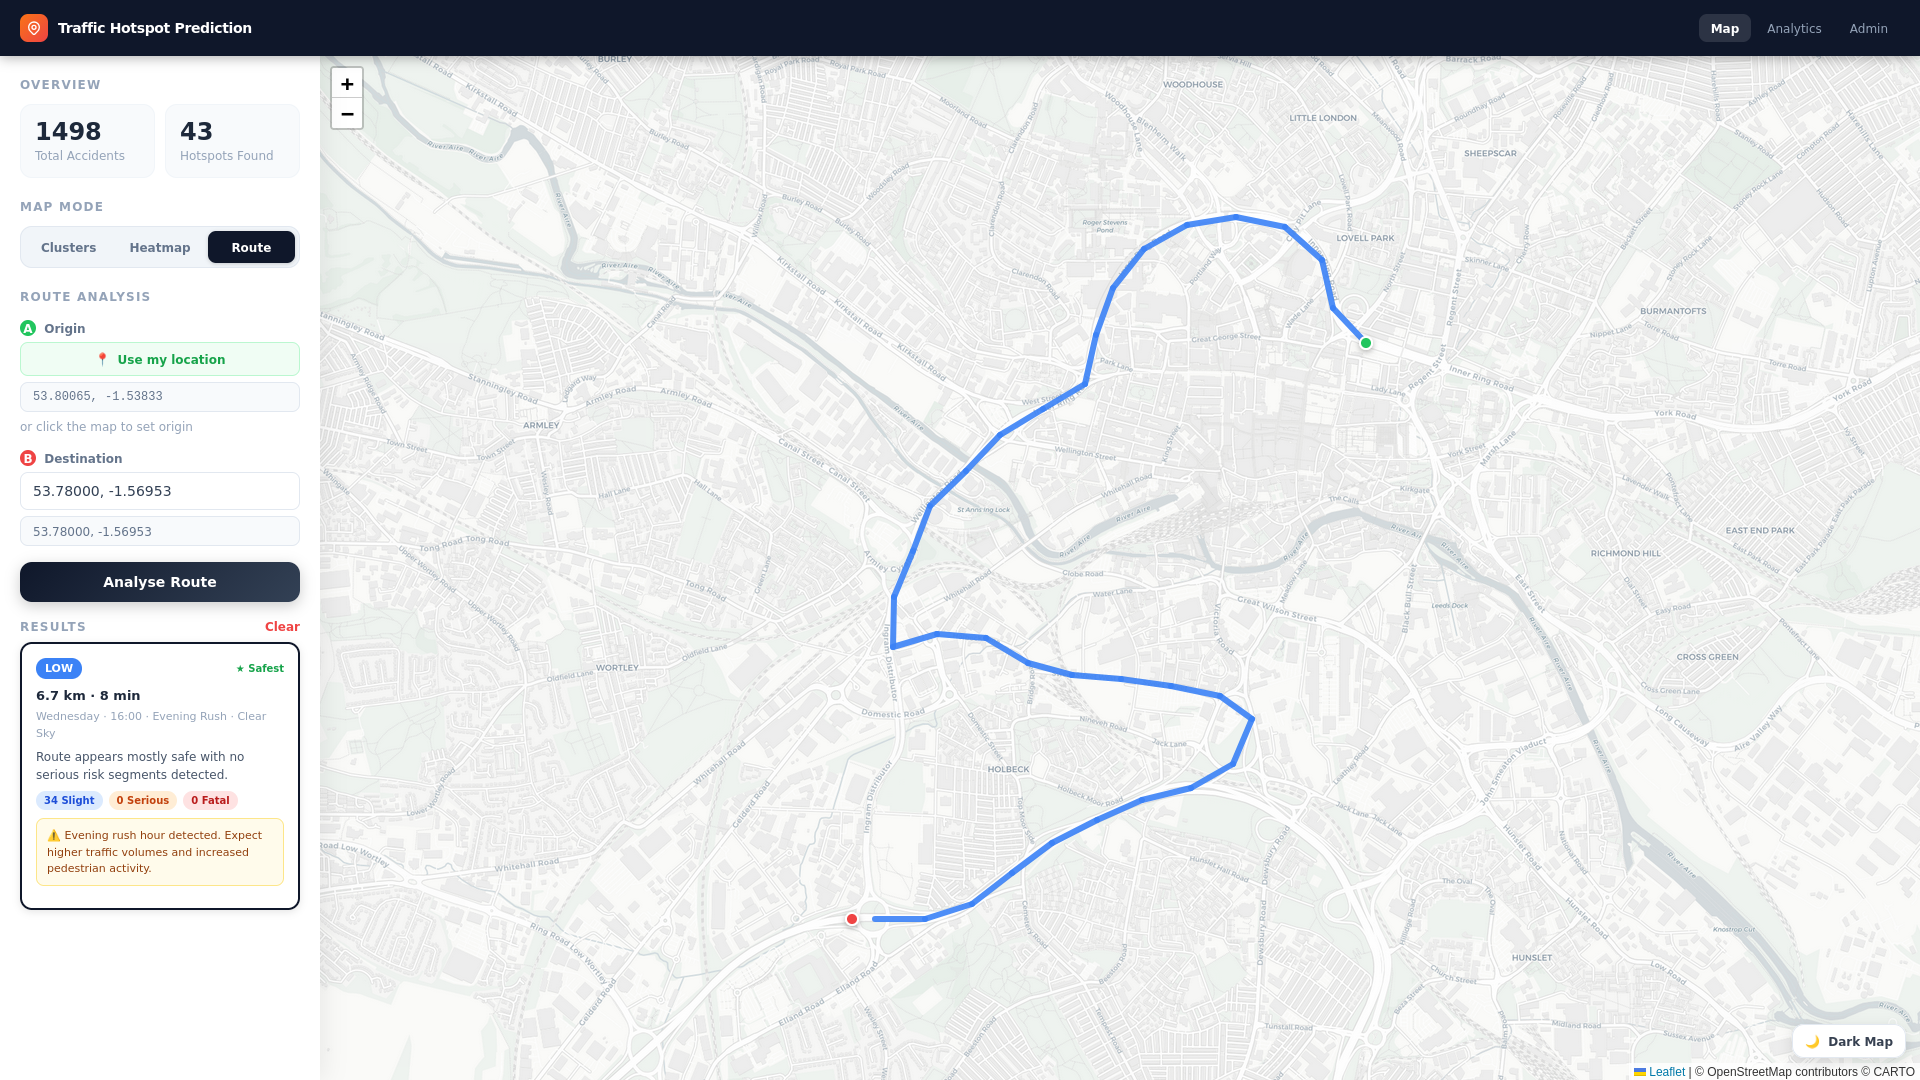
Risk prediction by time, weather, and road type — live in production
Deployed on Render with a fully interactive map interface